Johanna Busch
Quantitative Evidence of Academic Growth
I use a variety of quantitative assessments to determine student growth and to inform future instruction. One assessment I use is I-Ready. My students complete I-Ready reading and math three times a year. This adaptive computer-based assessment is aligned to standards. It provides detailed reports about each student's performance as well as suggestions for instructional groupings and strategies that will help students to grow even more. In this section, I will show how I use I-Ready math data in my classroom.
Overview of I-Ready
I-Ready is a national, adaptive assessment which students take on the computer. Because it is adaptive, I-Ready is able to assess students on standards that are below, on, and above their grade level. The test changes based on students' answers. Students answer questions based on their grade's standards as well as the standards of other grade levels. This allows I-Ready to give an accurate picture of a student's abilities even if they are above or below grade level.
I-Ready math provides an overall scale score. This score give the overall grade level at which a student is performing. To give a more specific picture of a students' abilities, I-Ready also gives a score and grade level for each of the Common Core math domains. In second grade, students are evaluated in Operations & Algebraic Thinking, Number & Operations in Base Ten, Measurement & Data, and Geometry. For each domain, I-Ready provides the teacher with a variety of suggested interventions based on a student's skill level. Suggested instructional groupings for the whole class are also provided based on students' strengths and gaps in each domain. Additionally, each student receives a password. Students can logon to complete lessons and play games tailored to their specific instructional needs.
I-Ready score reports provide information about a student's abilities that is easy to communicate to parents. The overall score as well as the domain scores are presented in a grade-level equivalent. This allows parents to easily understand how their student is performing compared to the standards for their grade level. Furthermore, each score report gives grade-level equivalent scores in each domain, allowing me to present parents with a more specific picture of their student's strengths and weaknesses and to suggest next steps.
More information about I-Ready can be found on their website by clicking here.
I-Ready Sample Questions
The below document provides sample second grade I-Ready math questions from the I-Ready Teacher Toolbox, which my school purchases to help students prepare for the test. This document provides a series of second grade level math questions that are similar to questions on I-Ready. However, because I-Ready is adaptive, students will answer questions from a variety of different grade levels, not just second grade. Before taking the end of year I-Ready test, students completed this sample test and we discussed the answers as a class. This provided students with an opportunity to discuss test-taking strategies for I-Ready and become familiar with the types of questions they would see.
The above document provides sample second grade I-Ready questions. These questions were taken from the I-Ready Teacher Toolbox provided by the Curriculum Associates.
I-Ready Placement Table
I-Ready provides placement tables based on students scale scores for overall math and in each of the four domains. I-Ready also provides tables of expected growth. The slideshow below shows placement scores for overall math and each domain. The column on the far left shows the grade level that students are currently performing on. I have put a red box around the scale scores needed for each level for second grade students.


The above placement tables are provided by Curriculum Associates (2018).
I-Ready also provides two different math placement tables for student growth. Both tables are shown below. Typical growth (shown in orange) is the average growth of students at each grade and placement level. Stretch growth (shown in blue) is the growth needed for below-grade level students to reach grade level and for on grade level students to reach advanced proficiency levels. I have highlighted the column that shows the number of points expected for typical and stretch growth for second grade students. The rows show the expected growth for students who are currently at various levels (on grade level early, mid or late or above or below grade level). I find these tables useful in setting goals for students based on their current placement. I use the stretch growth table to set goals because I want all of my students to grow to reach grade level.

The above growth placement tables are provided by Curriculum Associates (2018).
Data Analysis
Below are charts showing the BOY, MOY, and EOY I-Ready math scores for my second grade students from the 2018-2019 year. The pie charts show the number of students who are on or above grade level, less than one year below grade level, and more than one year below grade level based on their overall scale score (across all four domains) . The bar graph shows students' levels for each math domain.
These scores allow me to come up with growth goals for students. While it would be great if all of my students could reach grade level, realistically some students come in to second grade more than one grade level bellow. The goal is for all students to make dramatic academic growth based on the stretch growth form the I-Ready placement table shown above. Since some students are beginning more than two years below grade level, the goal is for their scale score to increase by the number of points in the stretch growth chart. Using a growth approach to working with I-Ready data allows me to set high but achievable academic goals for all of my students.
Based on overall I-Ready math scores, at the beginning of the year, none of my students were on or above grade level, thirteen students were less than a year below grade level, and twelve students were more than a year below grade level. By the end of the year, twelve students were on grade level, eleven students were less than a year below grade level, and two students were two or more grade levels below. Though I will unpack the data further, just these overall scale scores show that my students achieved dramatic academic growth according to I-Ready math.
Beginning of Year I-Ready Data

The above charts show my class's BOY I-Ready data from 2018-2019.
The above charts show my students I-Ready scores at the beginning of the year. BOY tests were taken in October. The placement by domain charts show that students were slightly stronger in the domains of Measurement and Data and Geometry. More gaps existed in the domains of Number and Operations and Algebra and Algebraic Thinking. However, overall this data shows that my students' abilities were fairly consistent across domains. With a few exceptions, about half of students were less than one grade level below and about half were more than one grade level below.
This data suggested that I had two distinct groups of students with respect to math skills. About half of my students were approaching grade level, while the other half were still struggling with foundational skills. Based on this, I decided to plan to teach math in a split block. I divided my students into two groups, based on I-Ready and other data, and taught two differentiated math lessons every day. When students were not with me, they worked on independent work or a collaborative math center. This two tiered approach allowed me to use data to meet every student's needs.
Middle of Year I-Ready Data

The above charts show my class's MOY I-Ready data from 2018-2019.
When students completed MOY I-Ready testing in January, it was clear that they were on the right track. Though only one student tested on grade level overall, several students moved from red to yellow (from two or more grade levels below to one grade level below). Additionally, students made significant progress in the three domains that we had primarily worked on, Numbers and Operations, Algebra and Algebraic Thinking, and Geometry. Multiple students moved from red to yellow or yellow to green in each of these domains, showing growth. Students' scores did not show much growth in measurement and data, which made sense because we were not planning on reaching this unit until February. This data suggested that my two-tiered approach to math was giving students in both groups the support that they needed to make dramatic academic growth.
End of Year I-Ready Data
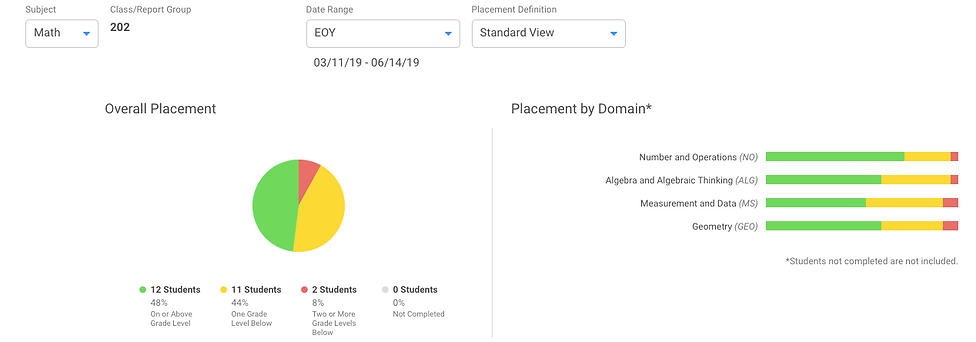
The EOY I-Ready math data showed that students grew dramatically since the beginning of the year. At the beginning of the year, none of my students were on grade level. By the end of the year, 48% of my class scored on or above grade level in I-Ready math. Additionally, at the beginning of the year, 48% of students scored two or more grade levels below. At the end of the year only 8% of students scored two or more grade levels below. Students showed significant growth in all four domains. More than half of students scored on or above grade level in every domain but Measurement and Data. Students made the most significant growth in the domain of Algebra and Algebraic Thinking. This data suggests that most of my students made dramatic growth, moving from red to yellow or yellow to green.
Teacher Reflection
I am very proud of my students for making such dramatic gains in math this year. At the beginning of the year, every student was below grade level in math. Now, in March, 12 of my 25 students are on or above grade level. 11 students are one grade level below. My students were able to make these dramatic academic gains because I based my math instruction on their initial I-Ready score reports. Last year, as a first year teacher, I was not able to differentiate math instruction as much and my students did not make the dramatic gains that they are now showing. This year, I used data to drive my entire approach to teaching math. Constantly differentiating math instruction based on data allowed all of my students, whether they were close to mastering grade level concepts or not, to exhibit dramatic academic growth.
Overall, students were expected to grow between 18 and 36 points, according to the I-Ready growth charts. Two students met their growth goals, and two students did not meet their growth goals. The other twenty-one students exceeded their growth goals based on the I-Ready growth chart.
Though standardized tests like I-Ready have many flaws and are not reflective of a student's holistic strengths and knowledge gaps, dramatic growth on these tests demonstrates that students are progressing in math. As a second grade teacher, it is crucial that my students make up these gaps at a young age so that they can continue to prepare for college and careers.